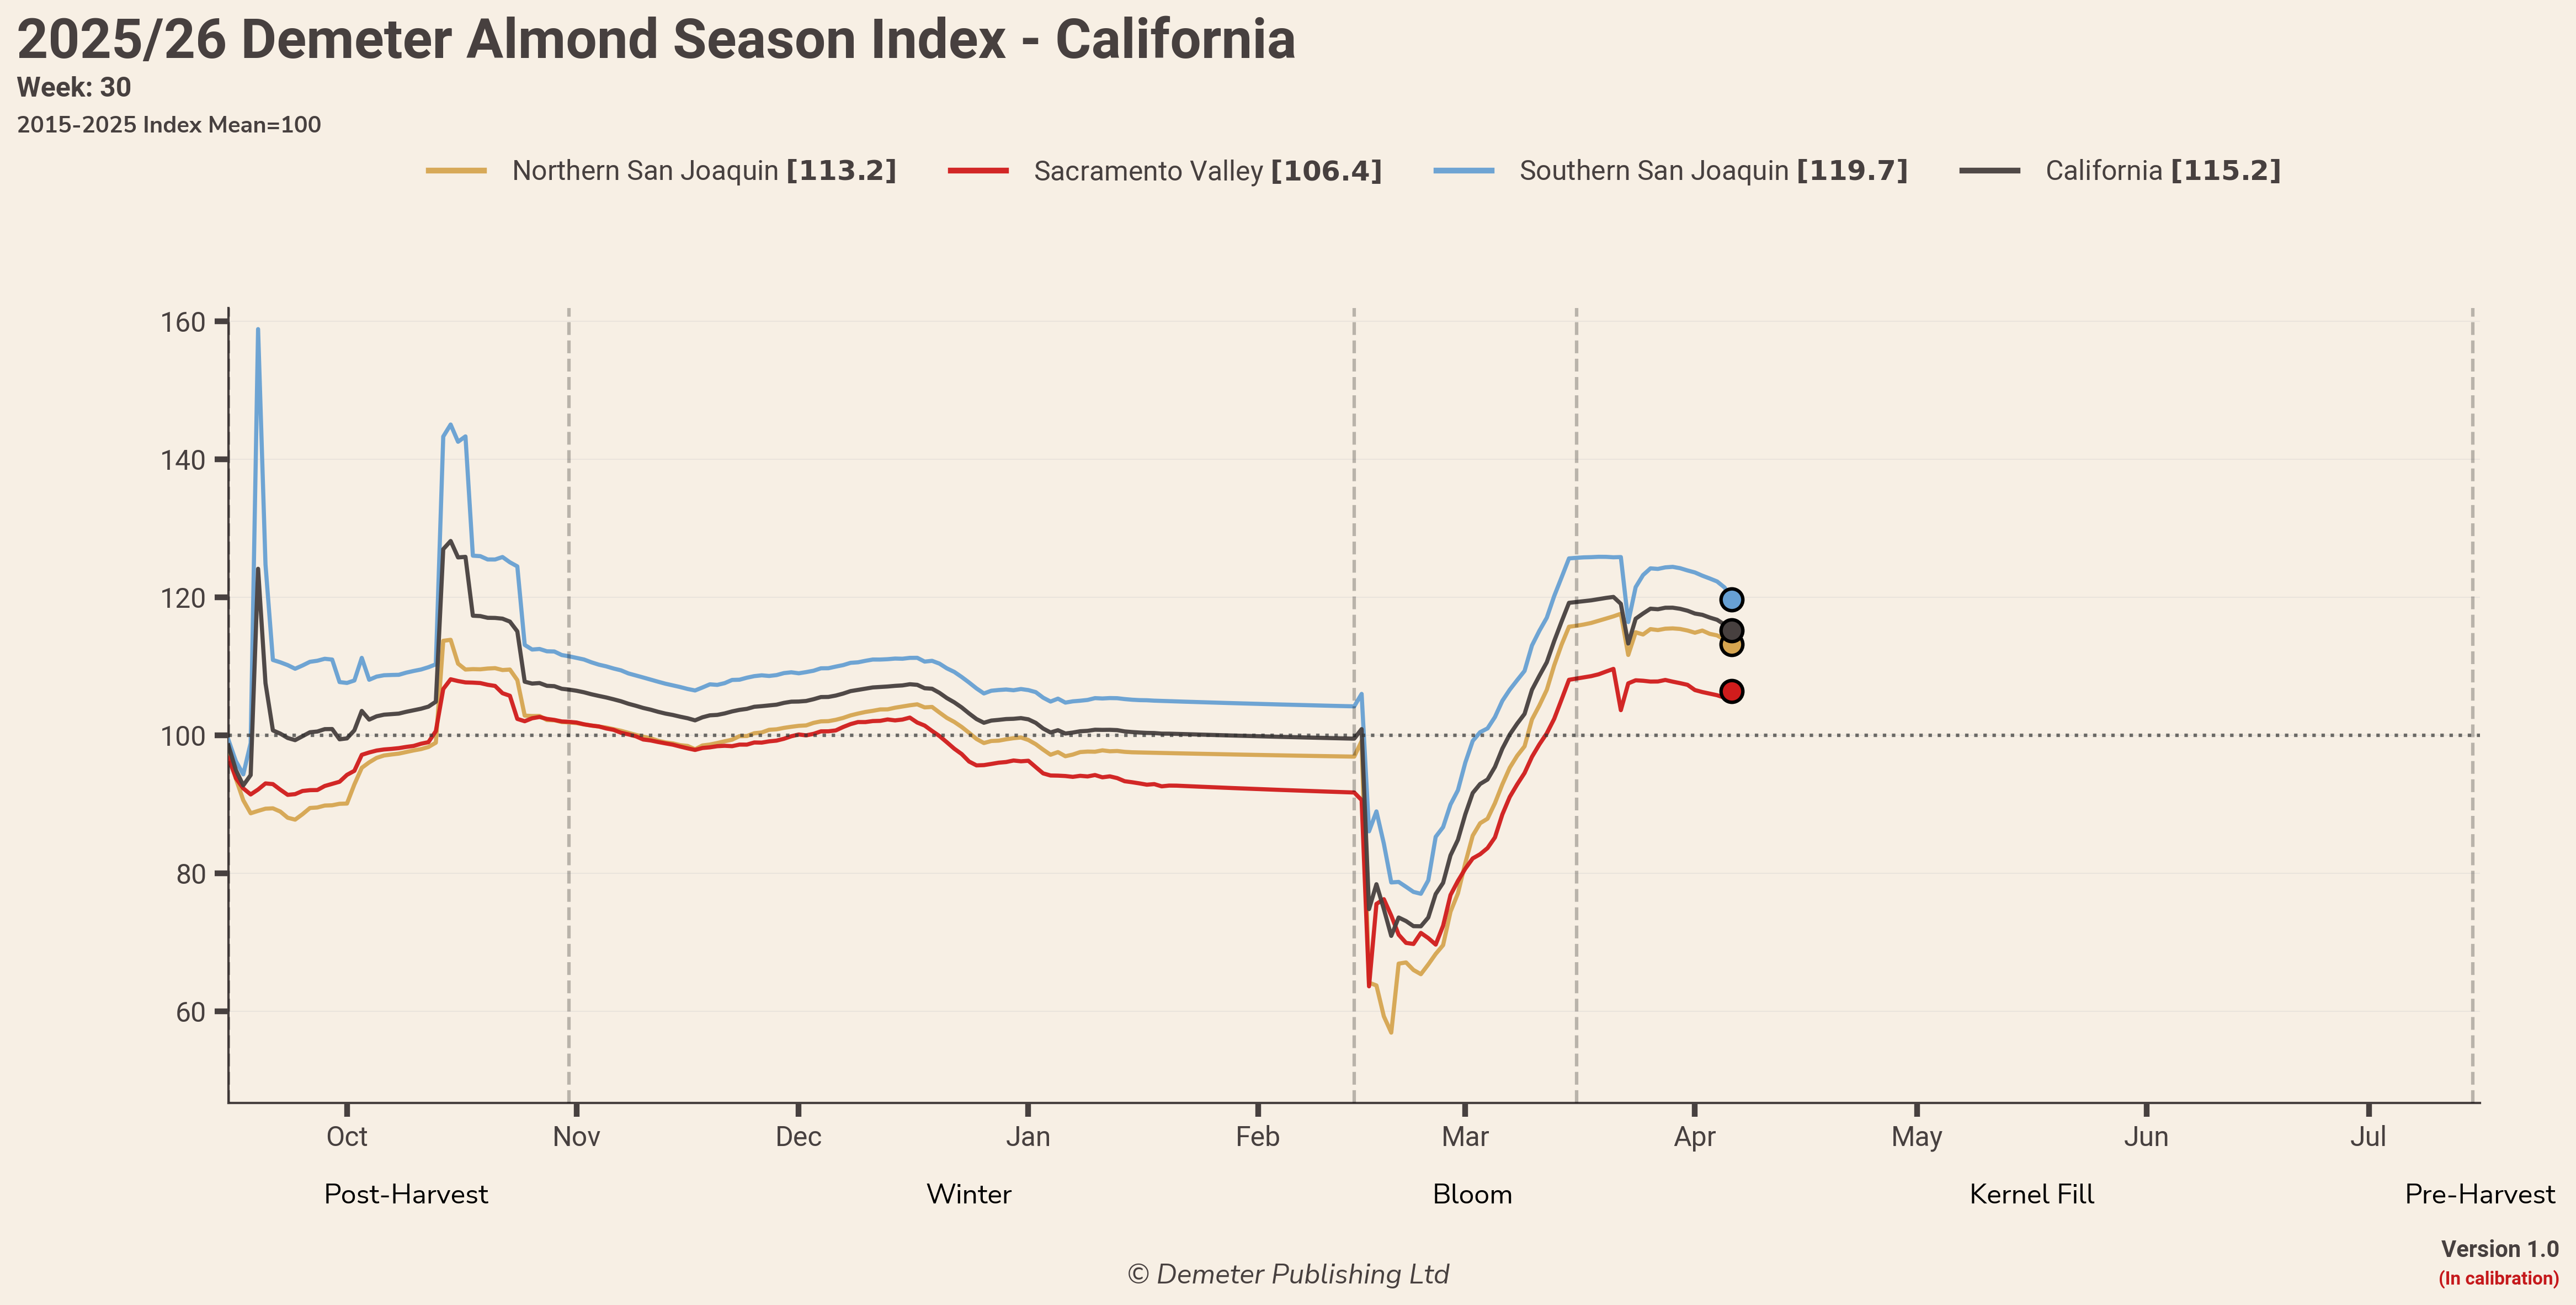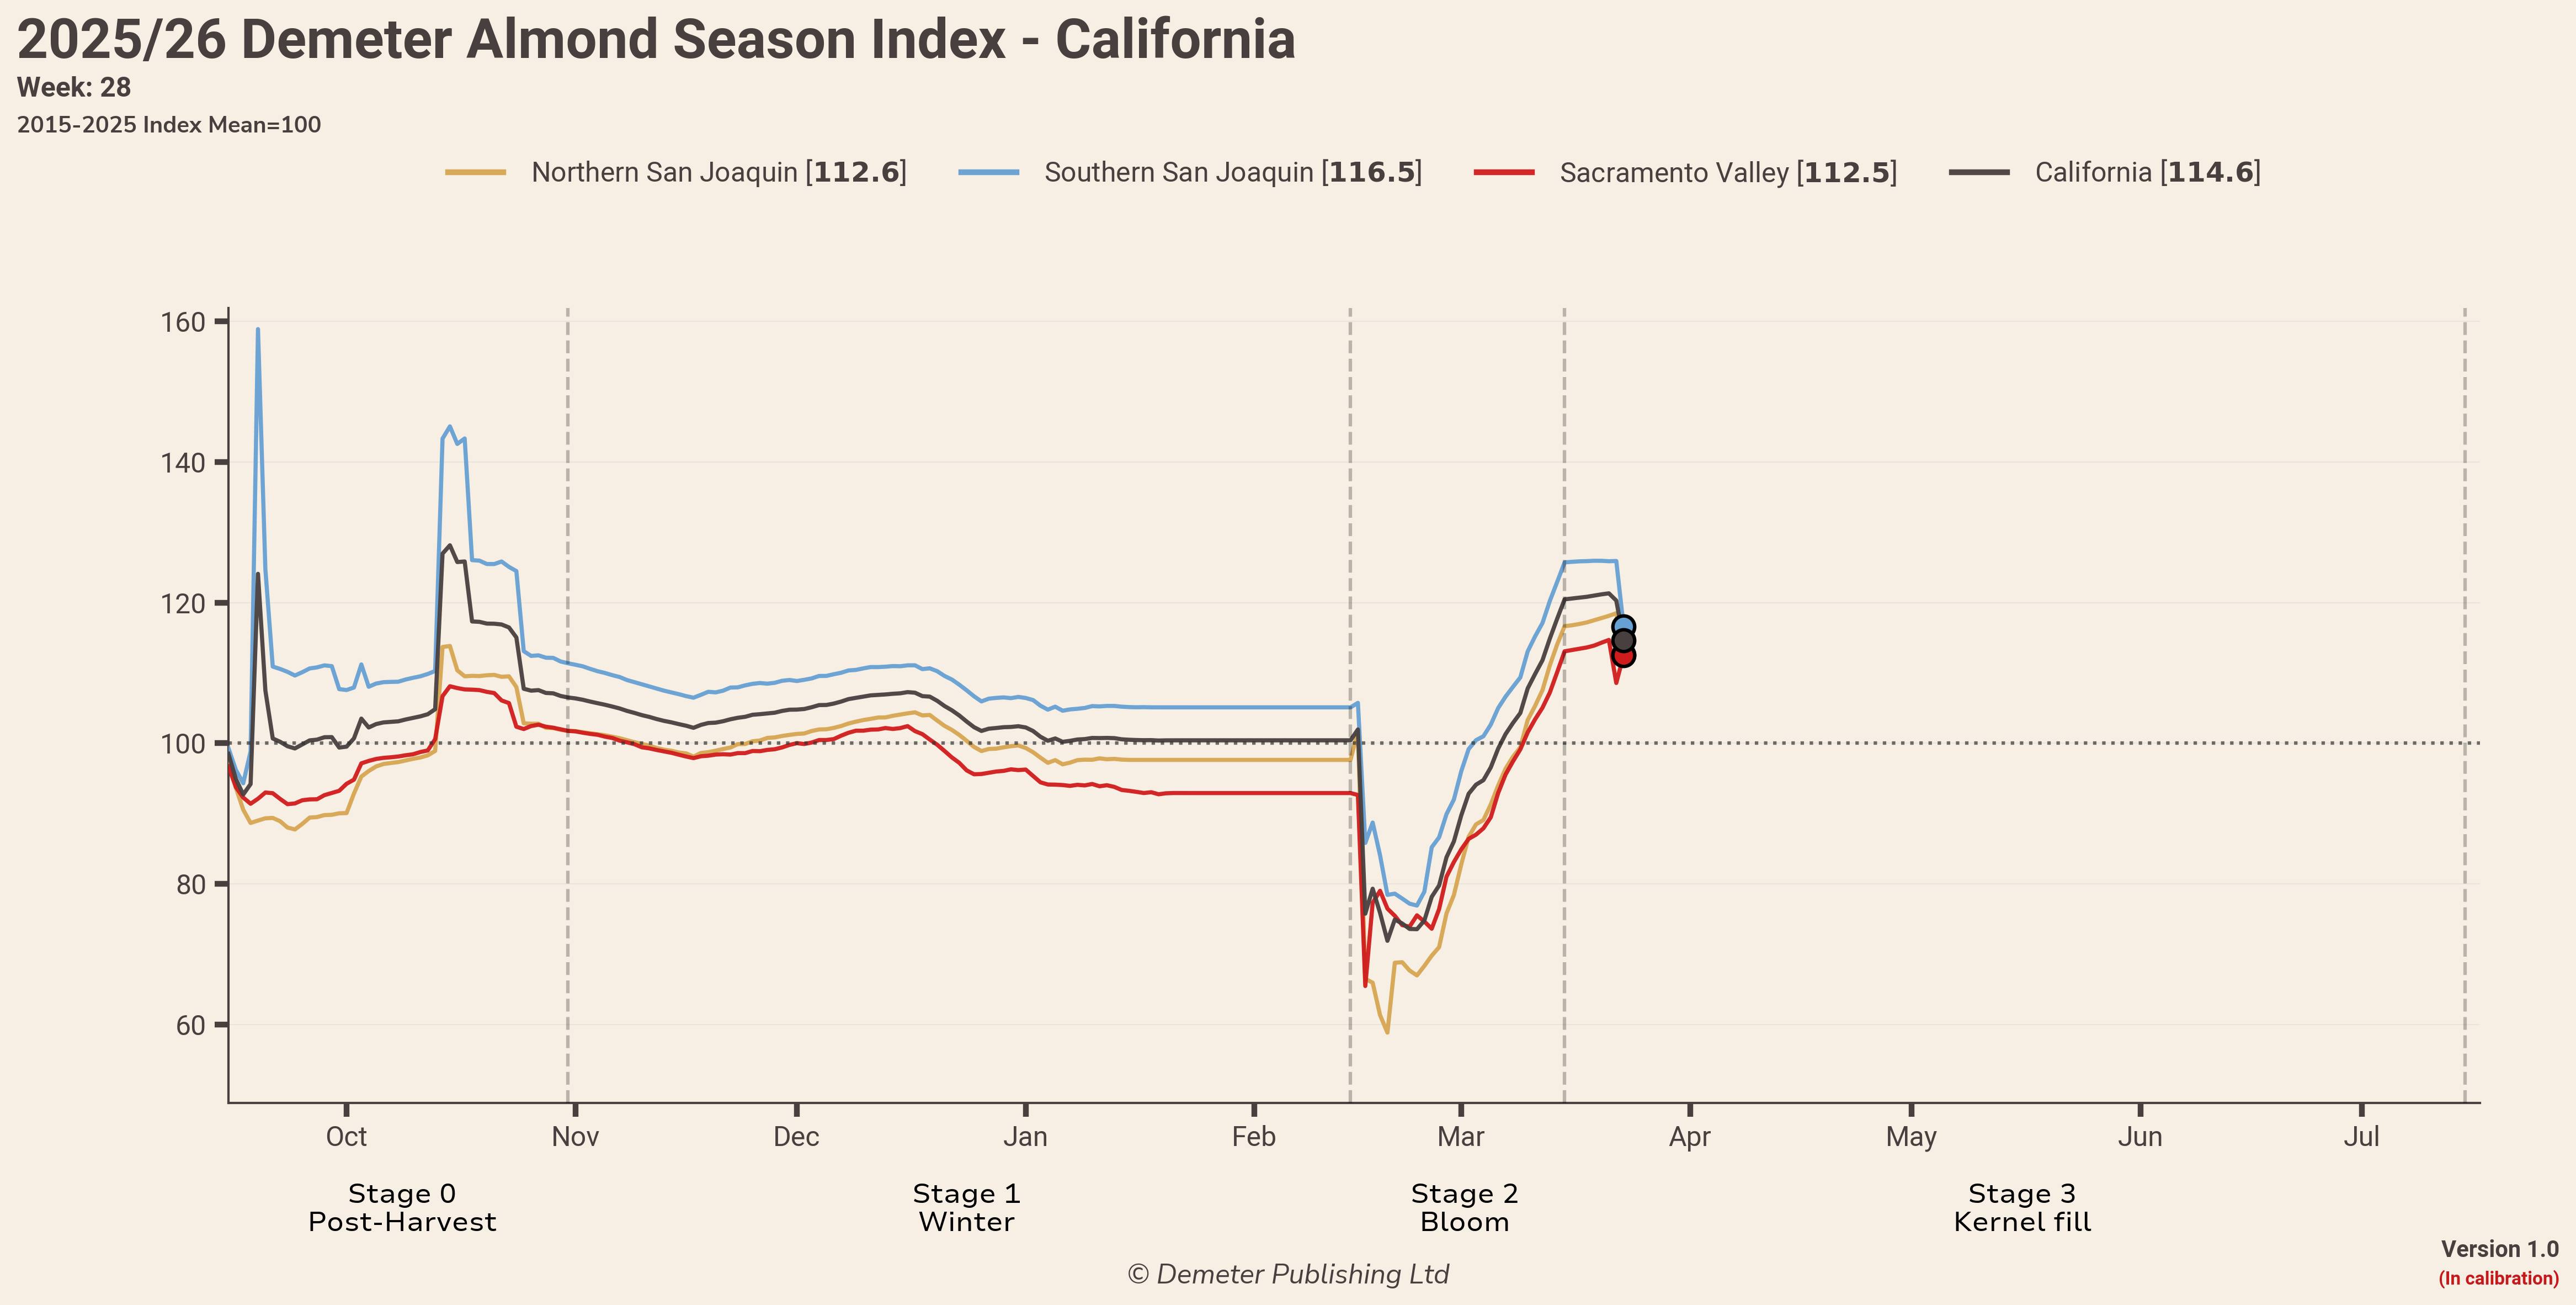
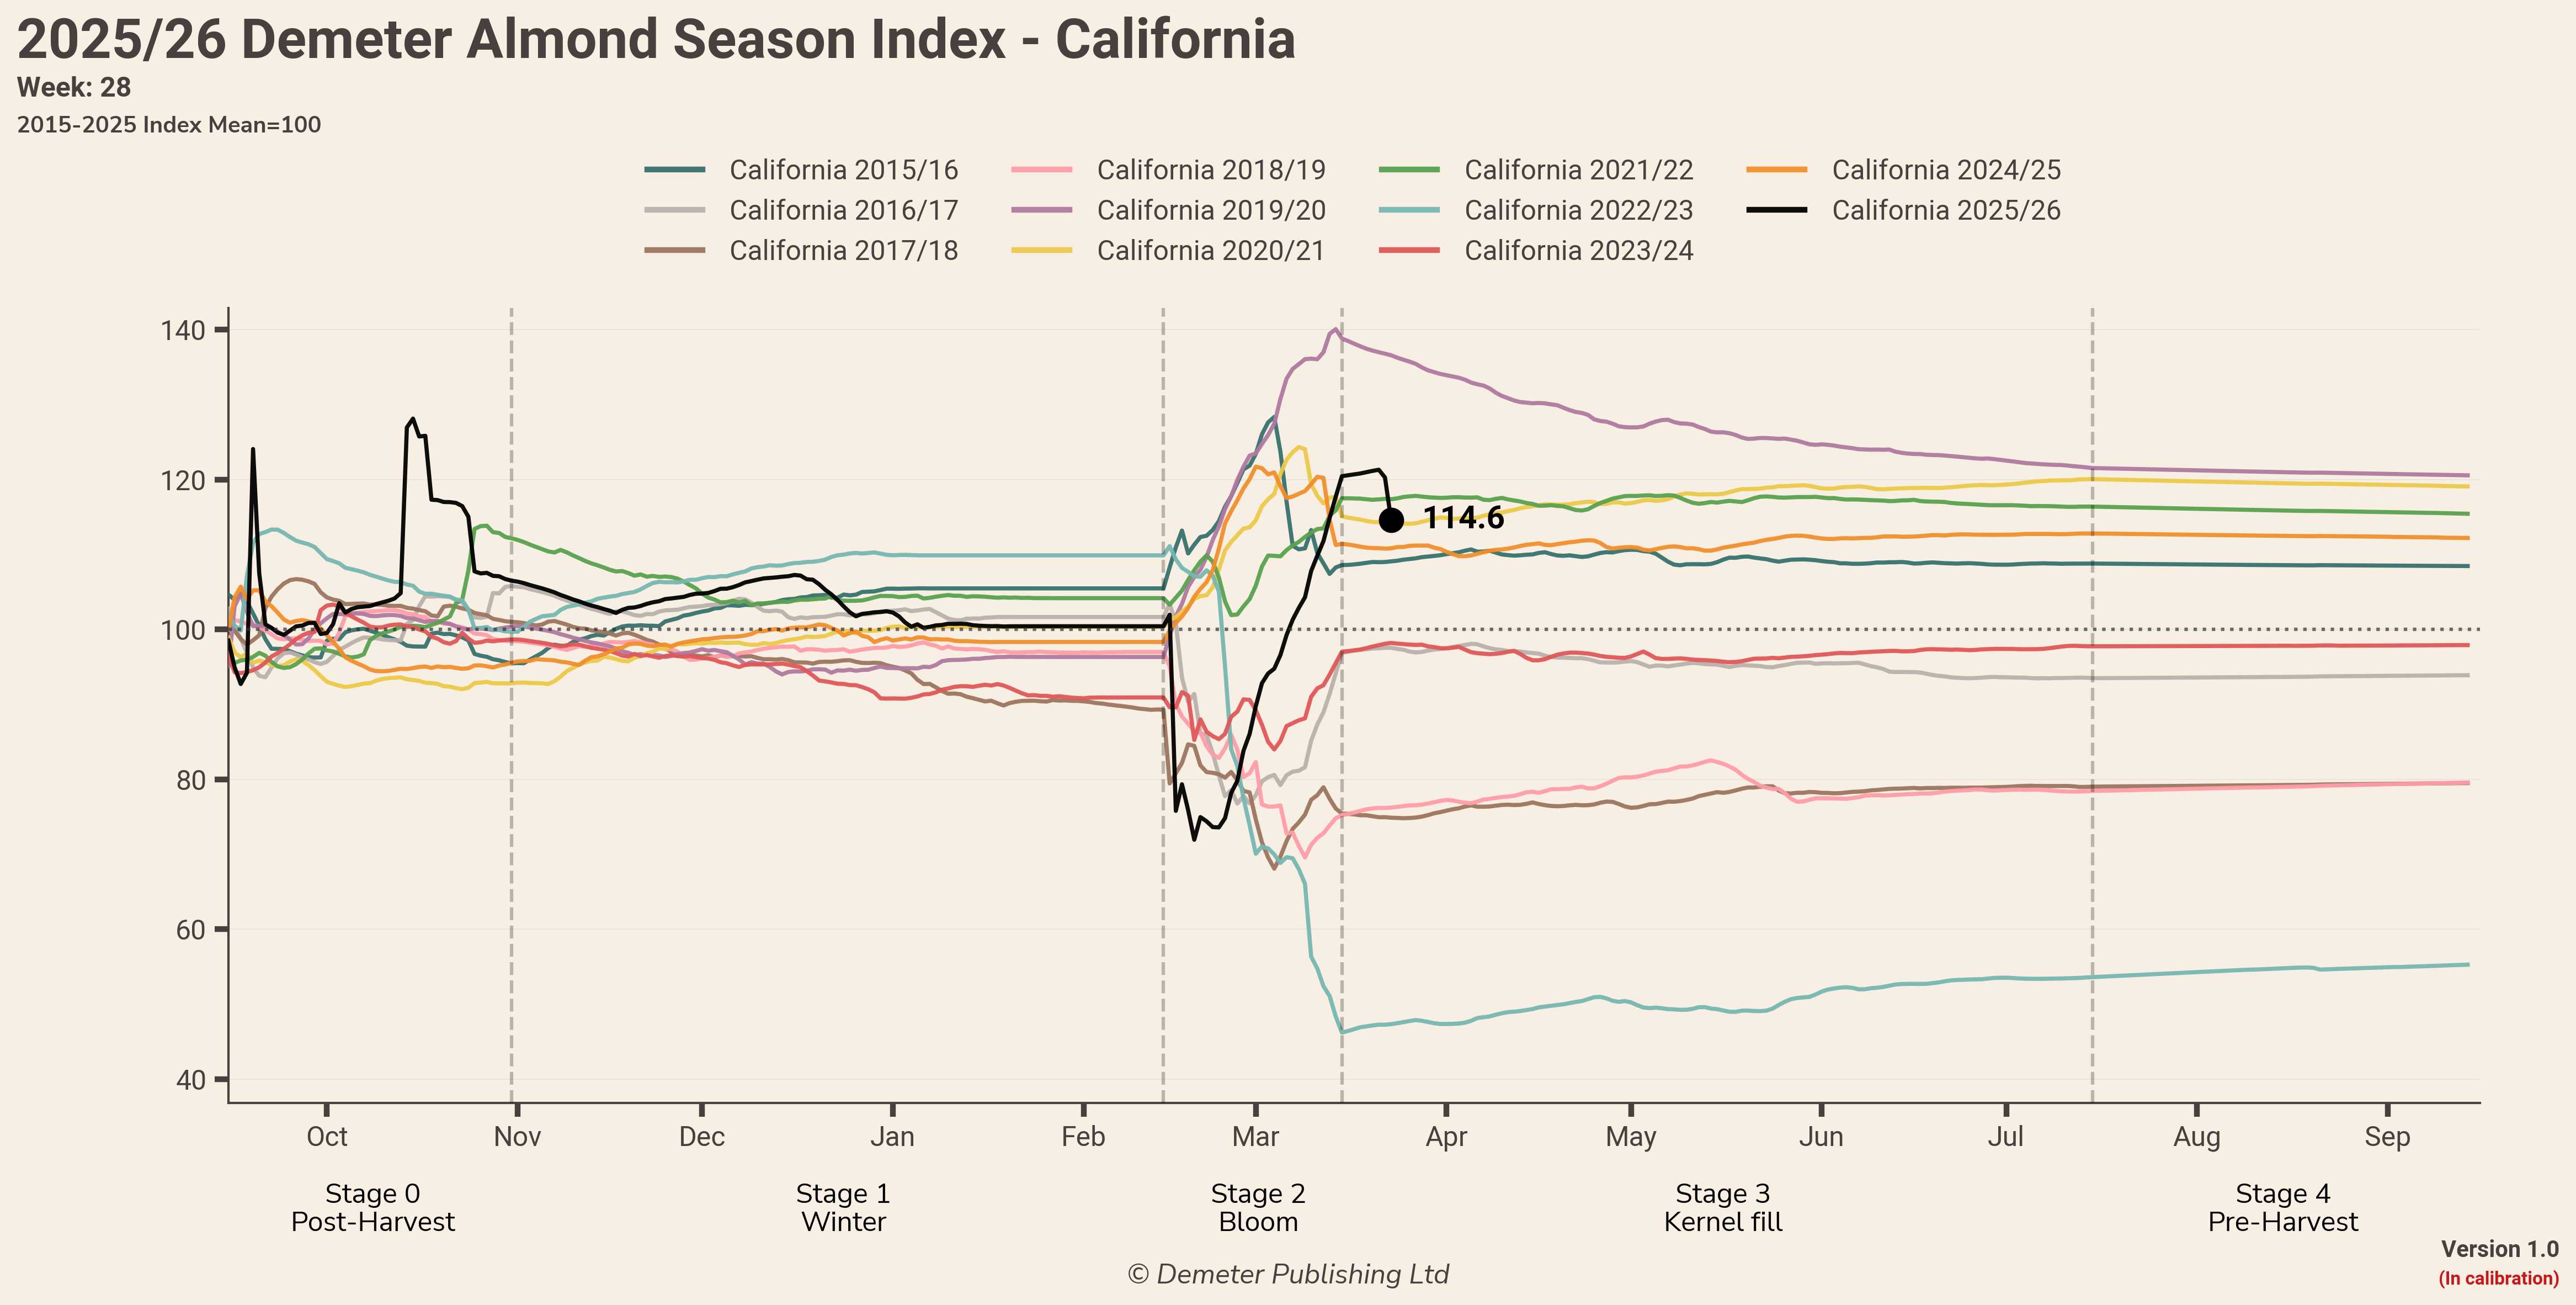
An unusually wet start to the bloom period gave way to highly favourable conditions that reversed February’s decline, leading DASI to its second-highest level in 10 years by the conclusion of bloom.
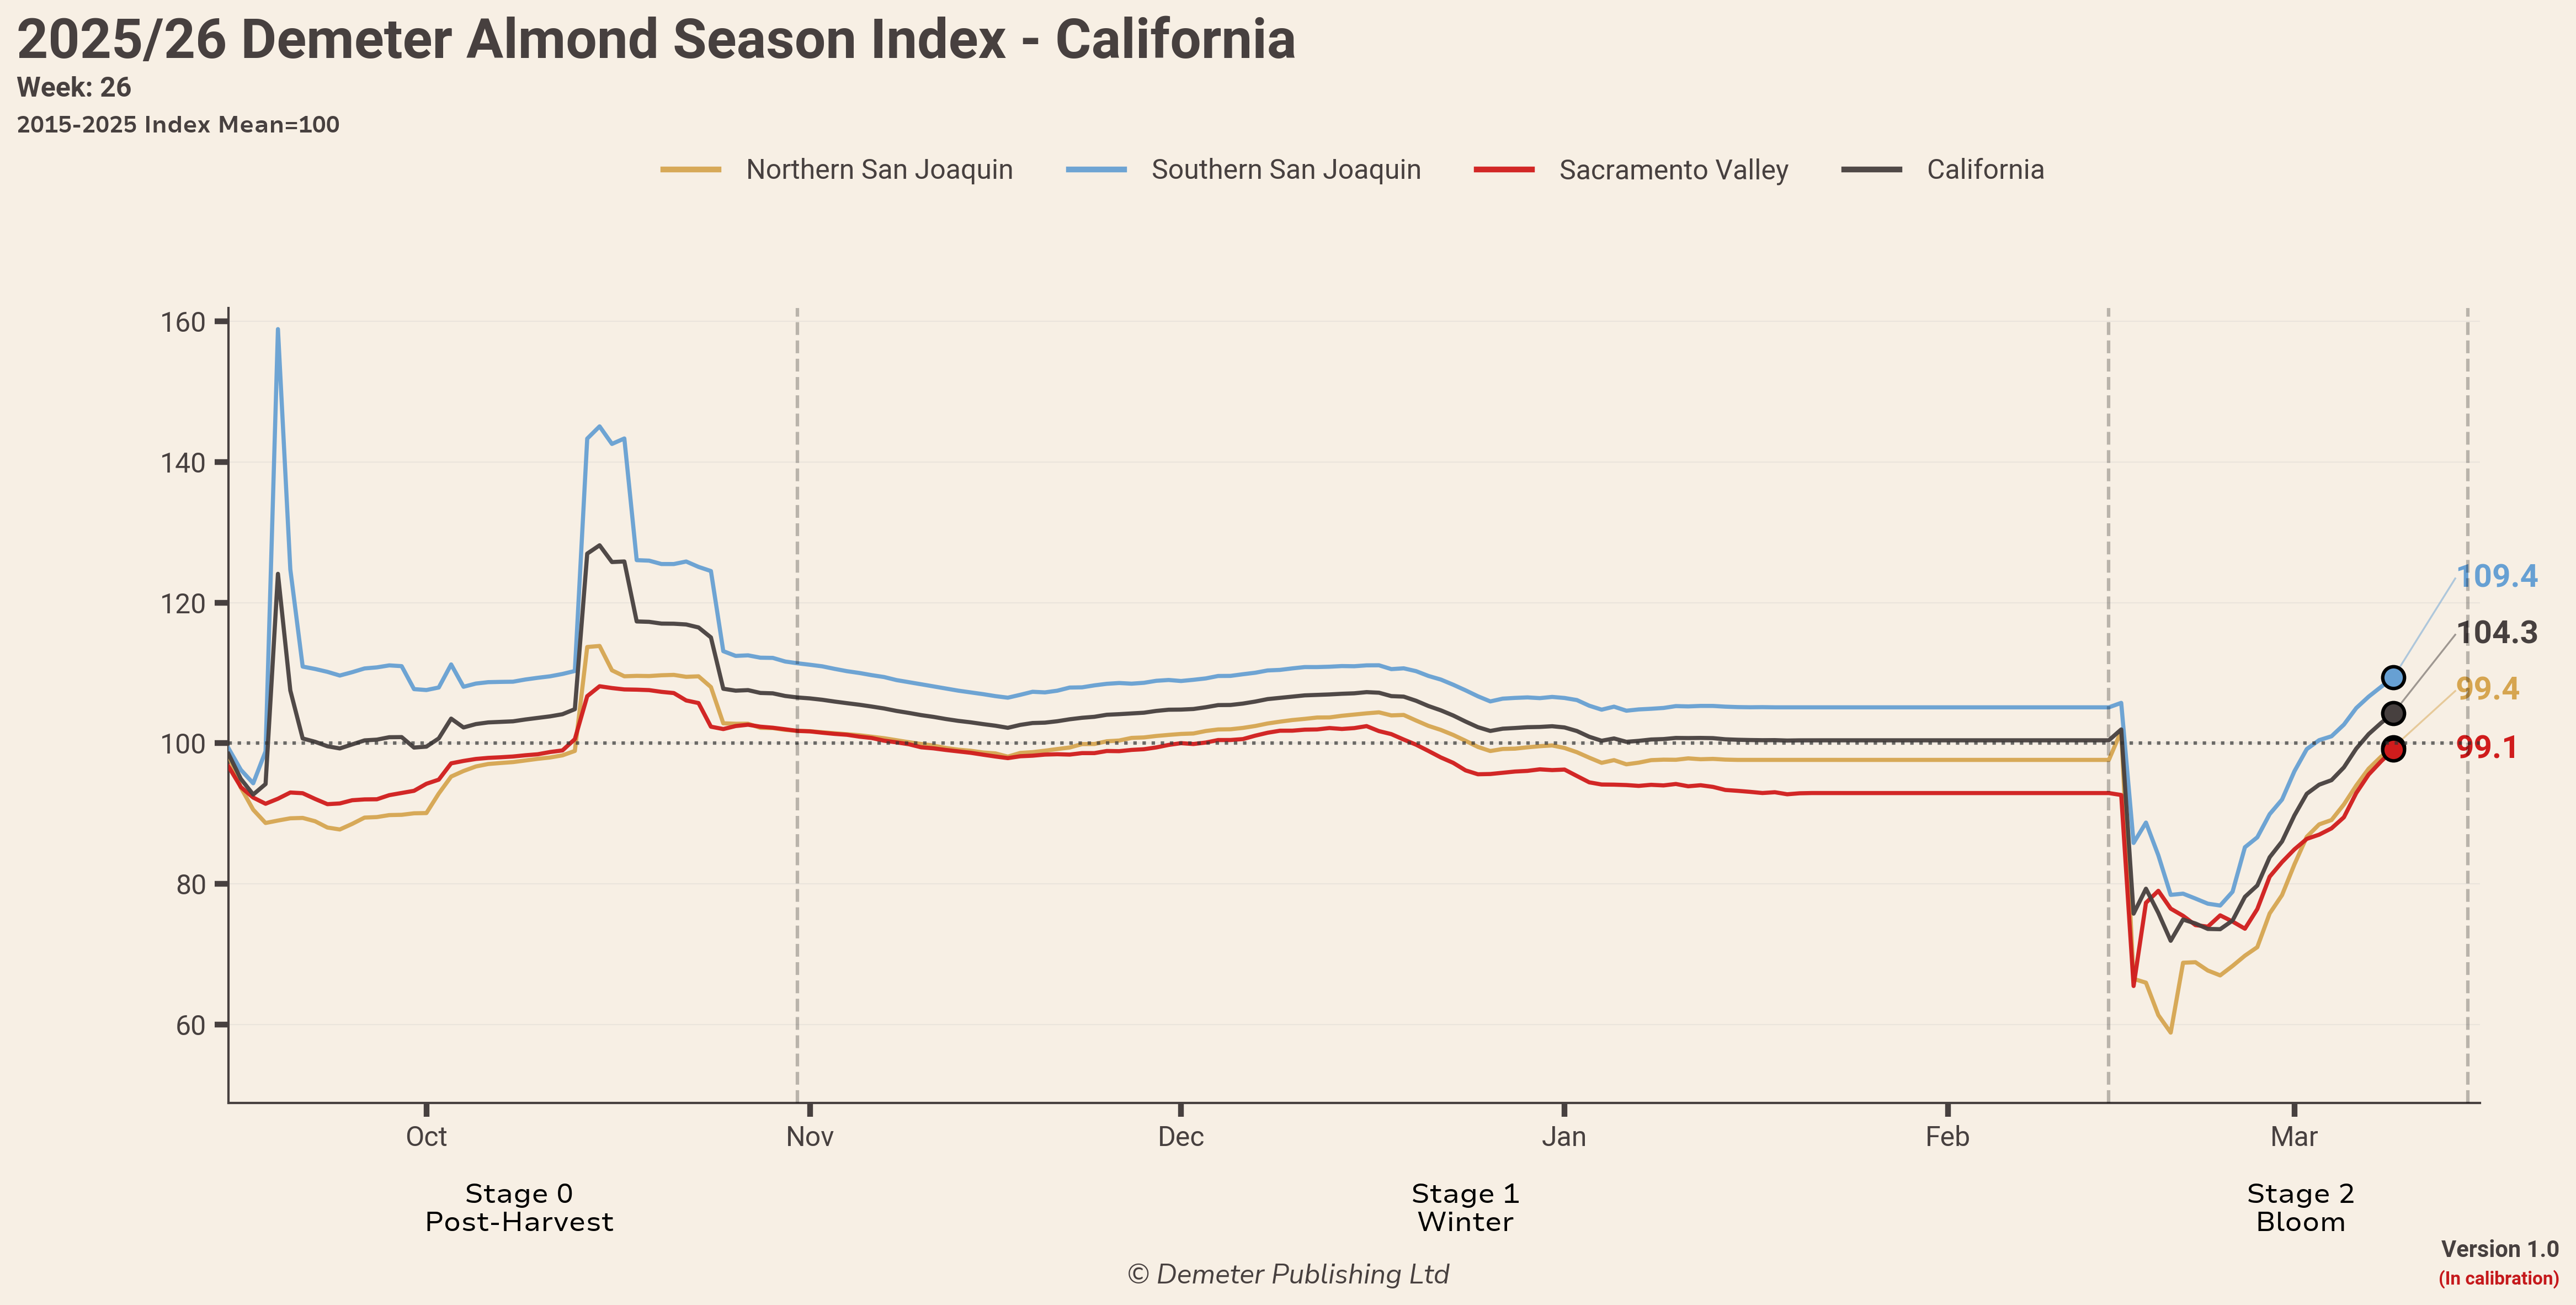
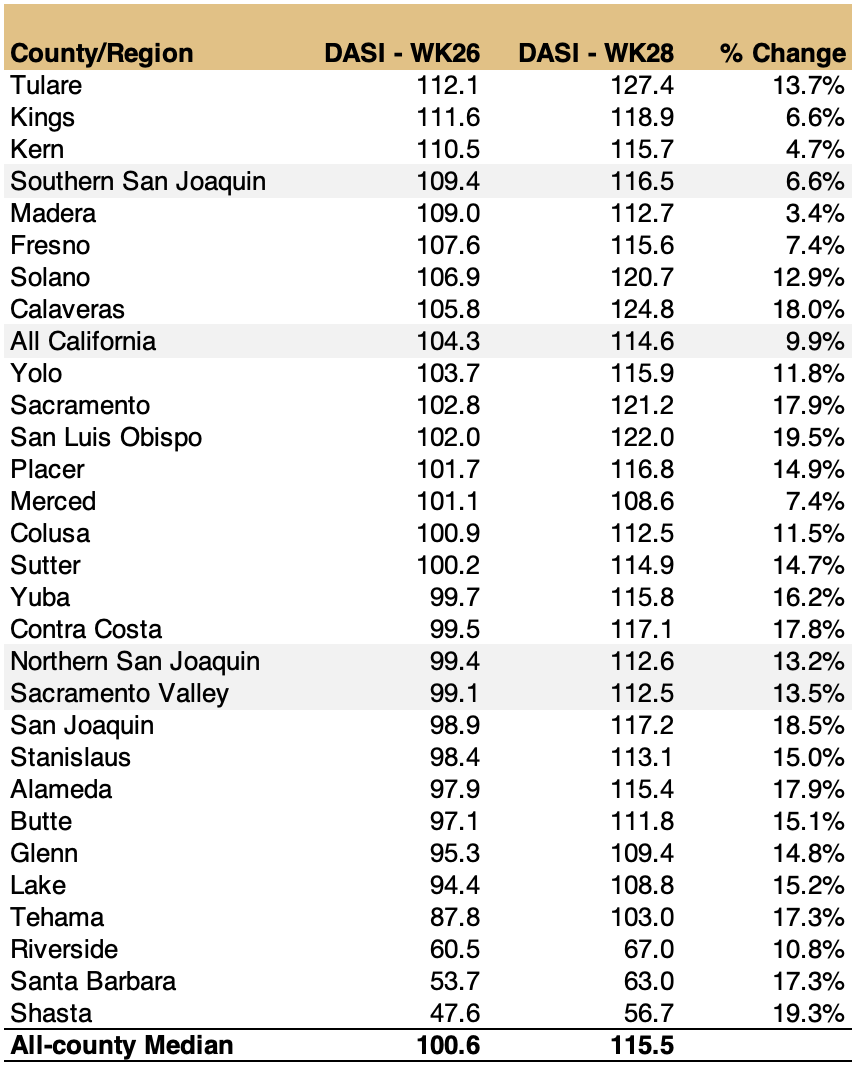
Abnormally high temperatures throughout the state since bloom have tipped into early heat stress, driving DASI off its highs. The effect was particularly marked in the Southern San Joaquin Valley.
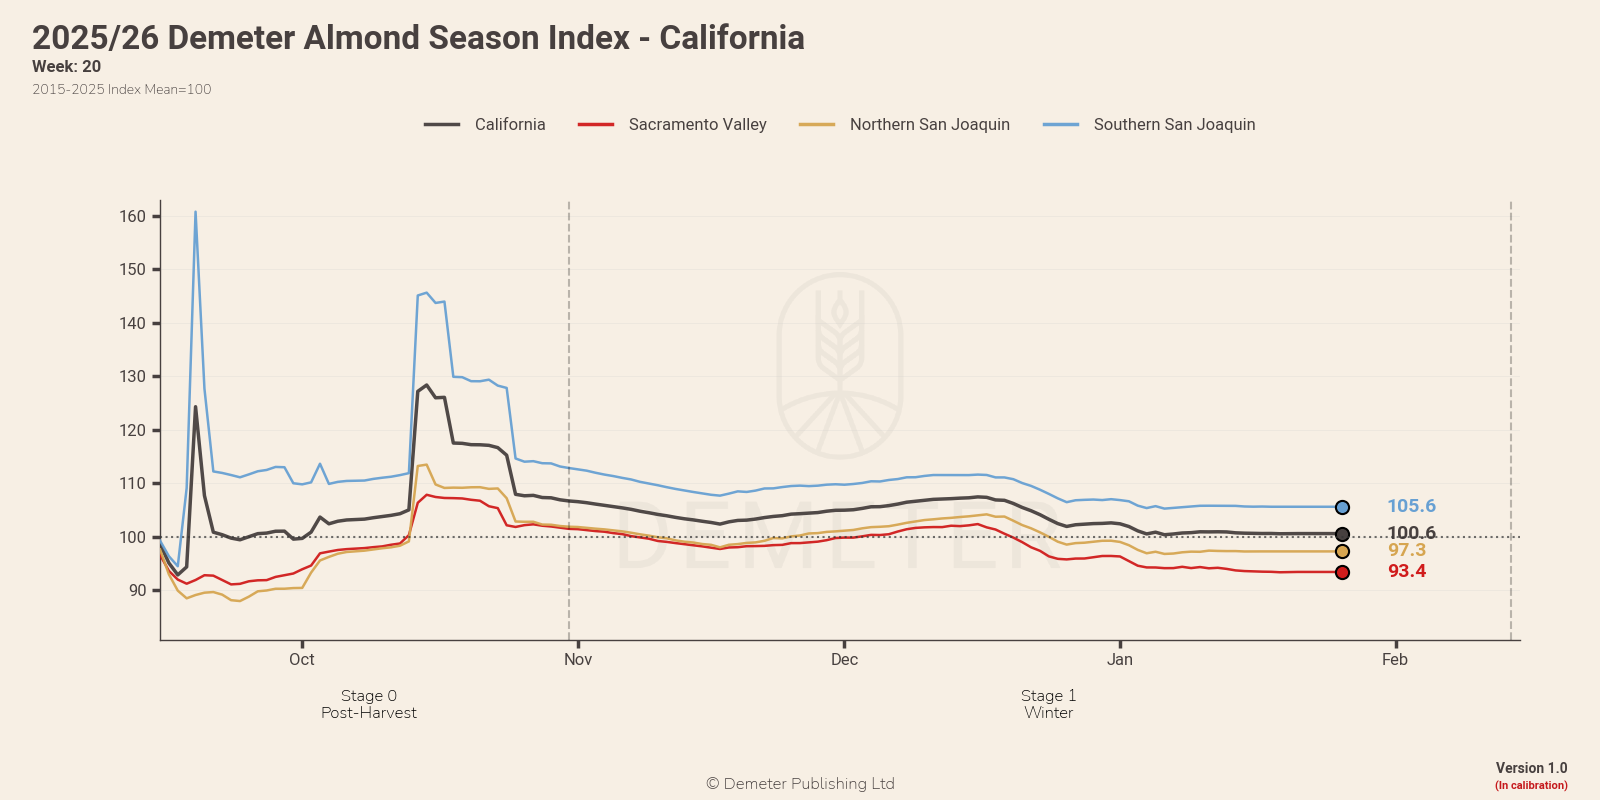
10-year comparison
County-level breakdown - Week 28
The Index methodology is available to review here
Sign up to receive the bi-weekly headline index publication by email here . DASI is published every other Monday at 4am PST/12pm GMT.
More granular views of the index (county level, irrigation district, GSA and custom footprints) are available via the Demeter platform . Please get in touch to discuss platform access.